

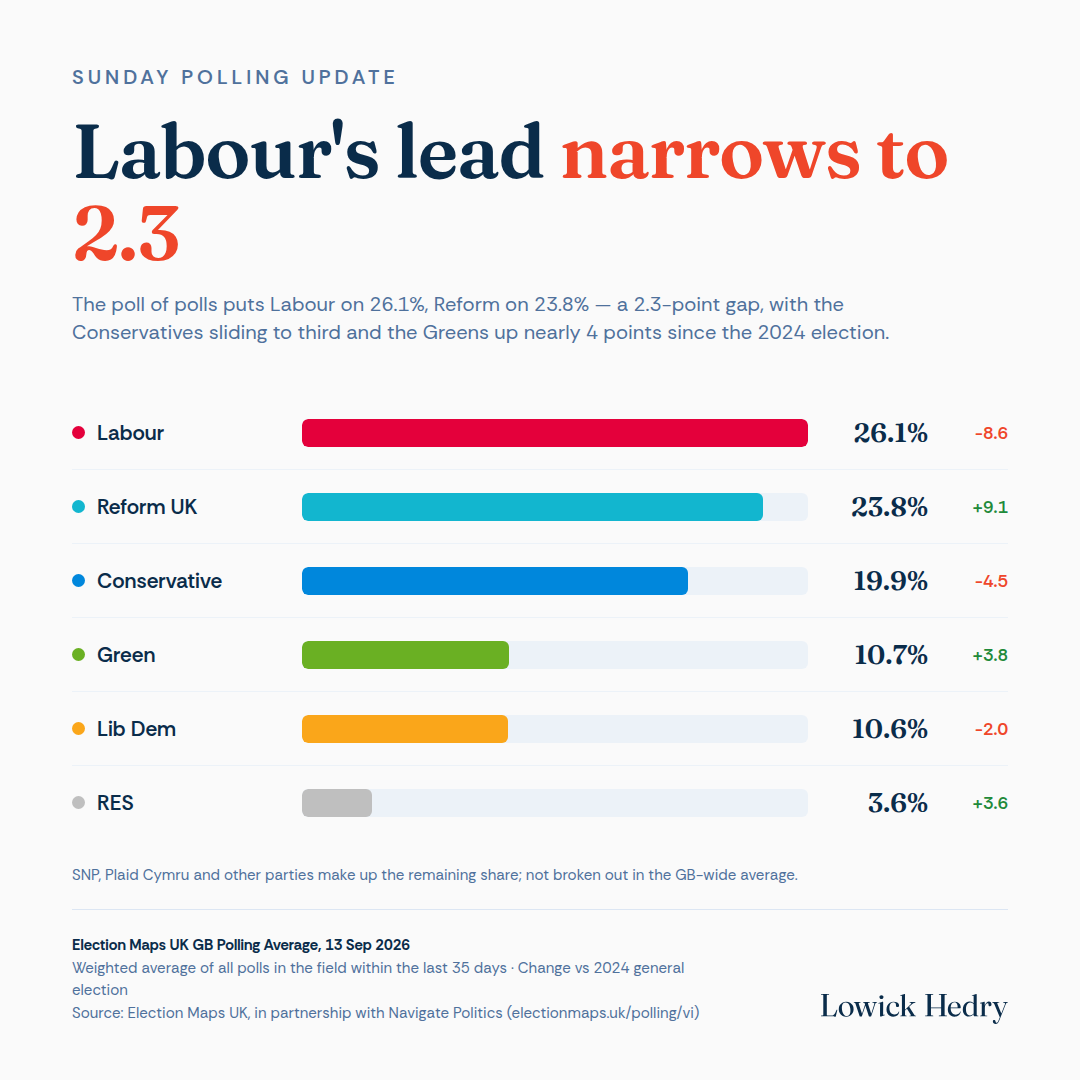
Labour’s lead has narrowed to 2.3 points, and the seat model now points to a hung parliament.
This week’s poll of polls, compiled by Election Maps UK from every voting intention survey published in the last 35 days, has Labour on 26.1% and Reform UK on 23.8%. That gap has closed sharply since the last general election, where Labour’s margin over its nearest rival ran into double figures. The Conservatives sit third on 19.9%, down four and a half points on 2024, and the Greens have picked up nearly four points to draw level with the Liberal Democrats on around 10.5% each.
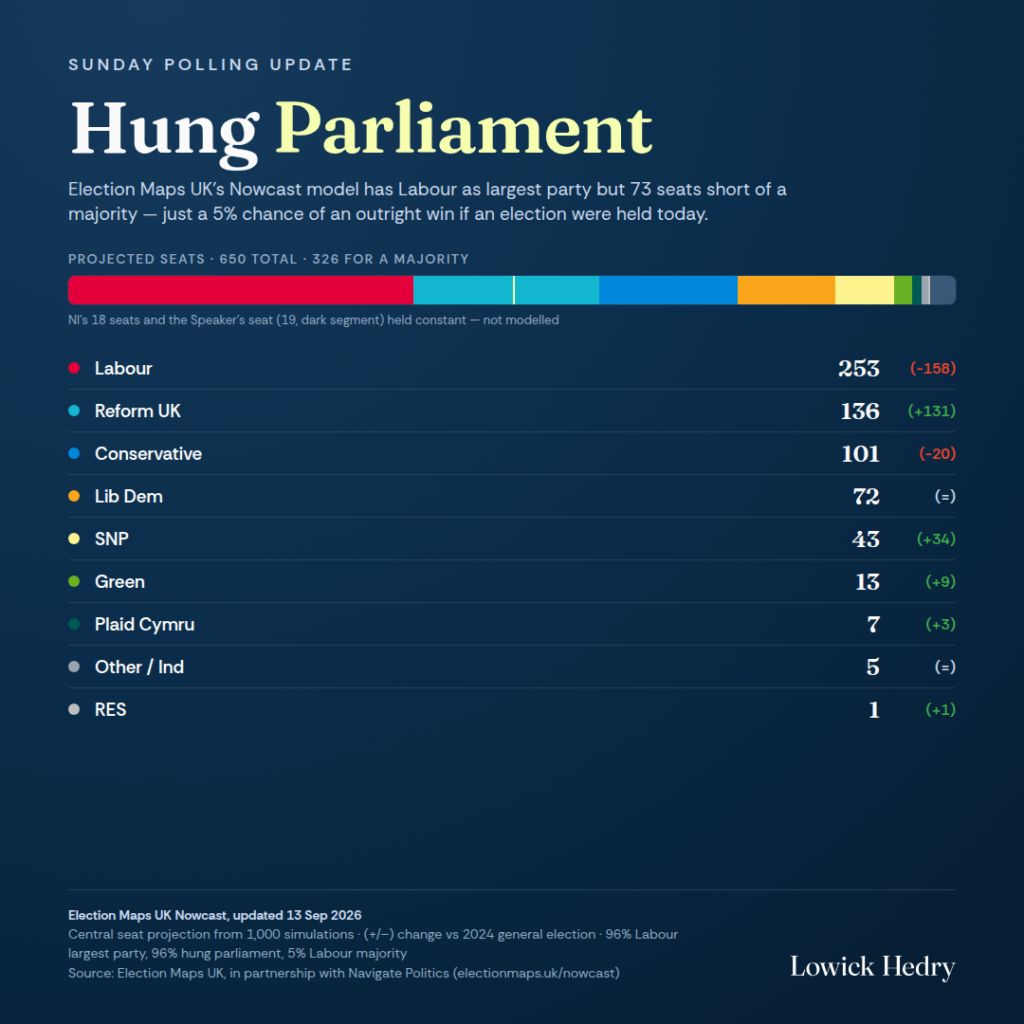
The seat projection is the more striking number for Westminster-watchers. Election Maps UK’s Nowcast model, run over 1,000 simulations, has Labour as the largest party on a central projection of 253 seats, some 73 short of the 326 needed for a majority. Reform UK’s projected seat count has jumped from 5 in 2024 to 136, and the Conservatives have fallen to 101. On the model’s own numbers, Labour remains the largest party in 96% of simulations, but the country ends up with a hung parliament in 96% of them too. Just 5% of simulations produce an outright Labour majority.
Two things are worth flagging for anyone reading the numbers closely. First, the seat model holds Northern Ireland’s 18 seats and the Speaker’s seat constant rather than modelling them, so the 650-seat total in our graphic includes a fixed, unmodelled block alongside the 631 projected GB seats. Second, the GB polling average groups the SNP, Plaid Cymru and smaller parties into the balance rather than breaking them out individually, so our vote share graphic reflects the six parties Election Maps UK reports at GB level.
We’ll have the next update in seven days.
Sources
- Election Maps UK, “Polling | Voting Intention” (GB Polling Average and all-polls archive), electionmaps.uk/polling/vi, accessed 13 September 2026.
- Election Maps UK, “Nowcast Model” (seat projection, central projection and majority odds from 1,000 simulations), electionmaps.uk/nowcast, last updated 13 September 2026.
- Election Maps UK methodology: accuracy weighting by historic pollster performance, frequency balancing across pollsters, a 35-day time-based kernel average, and bisquare outlier rejection, as set out on the Voting Intention page.
- Election Maps UK is run by Matt (@electionmapsuk) and has been sponsored by Navigate Politics since August 2025.
Our view